
- About
- Computer Code
- Datasets
- Resources
- News
-
Menu☰
The learning goal of this book is to master the commonly used statistical methods in climate science and use them for real climate data analyses and visualization using computers.
We hope that this book will quickly help you improve your skills of data science and statistics. You will feel comfortable to explore large datasets in various kinds of data formats,
compute their statistics, generate statistical plots, visualize the data, interpret your results,
and present your results. We appreciate the psychological value of instant gratification,
which is adopted in the design of most video games. We want you to gain some useful skill
after you have spent two or three hours reading the book and following the interaction procedures described by running and modifying our R code or Python code, and by exploring
the climate data visualization technologies, such as 4-dimensional visual delivery (4DVD)
of big climate data (www.4dvd.org). You might have noticed that we use the word “skill”
rather than “knowledge” gained from our book. We believe that you need skills and your
knowledge comes from your skills and your practice of the skills. We emphasize “do!” Our
book is designed in such a way that you will use your computer to interact with the book,
for example running R code in R Studio or Python code in Jupyter Notebook and Colab
to reproduce the figures in the book, or modifying the code for the analyses and plots
of your own datasets. Your interaction with the book is essential to effectively improve
your data science and statistics skills, which can be applied not only to climate data but
also to other datasets of your interest. We expect that your skill improvement will make
you more efficient when handling the data in your study or job, and hence will bring you
more opportunities. Specifically, you will be able to plot big data in the file formats of
.nc, .csv, .json, .txt, compute statistical parameters (e.g., mean, standard deviation, quantiles, test statistics, empirical orthogonal functions, principal components, and
multivariate regressions), and generate various kinds of figures (e.g., surface air temperature for January 1942, atmospheric carbon dioxide data of Mauna Loa, pie chart, box
plot, histogram, periodogram, and chi-square fit to monthly precipitation data). If you are
already sophisticated with data analysis and statistics, you may appreciate our explanation of the assumptions and limitations of statistical methods, such as the four assumptions
for a linear regression, the test of serial correlation, and intuition of the theory behind
covariances and spectral analyses.
To help you quickly learn your desired skills, we try our best to make each chapter selfcontained as much as we can. This allows you to read the chapter of your interest without reading the previous chapters or with minimum references. We are able to do so because of your interaction with the book through your computer and the Internet with some help from learning resources freely available at our book website www.climatestatistics.org.
We wrote this book for the following groups of people: (i) undergraduate and graduate students majoring in atmospheric sciences, oceanic sciences, geography, and climate science in general to help them quickly gain the data handling skills for research, for supporting course work, or for job interviews; (ii) climate science professionals who may wish to check whether they have correctly applied statistical methods or answer questions from their junior colleagues, such as how to make inference on regression; (iii) college students in other majors who wish to use climate data as examples to learn data science skills and R or Python programming so that they can compete well
in the job market; (iv) college professors who wish to modernize their courses or curricula amid the development of the digital economy and who wish to find a textbook that allows them to effectively engage students to learn data science skills; and (v) senior or retired scientists and engineers who wish to use an interactive book to sharpen their mind by mimicking computer programs and generating beautiful figures.
A simple answer is that the need is wide and urgent. Almost all climate scientists wonder
at one time or another if a statistics method they or their students have used in a project
is sound. What are the assumptions and limitations of the method? They may wish to tell
a better story about the method and its results, which are appreciated and agreed upon
by professional statisticians. Students who take statistics courses taught by faculty from
the Department of Statistics often learn very little about real climate datasets, and find
that what they have learned is completely disjoint from the real climate science problems.
For example, a statistics course never offers chances to analyze a dataset of more than
2.0 Gigabytes in a .nc file, or to plot 2D or 3D graphics or maps. This is so because
traditional books are theory based or based on small datasets because of limited access
to laptop computers. Some books are more advanced for research, but they still use the
figures adopted from publications, not easily reproducible by readers. Consequently, most
students of statistics courses forget what they have learned after the exams, and can hardly
tell a story about the usage of statistical methods. We wrote this book to fill this gap that
links assumptions and computing tools to real world data and practical problems. We intend
to train you with useful skills through your interactions with the book so that you will not
feel disjoint and unmotivated, because you have a chance to interact with the book and
work on your own datasets.
Both authors have taught climate statistics courses many times in the USA, Canada,
Japan, and China. In the earlier years, we taught using the old method, although we once in
a while used some real climate data. We learned the shortcomings of the traditional method
of teaching: one-directional instruction and lecture from professors to students. One of us (S. S. P. S.) changed the one-directional method to the interaction method of instruction
in 2015, when it was feasible to require every student to bring a laptop computer to the
classroom. This interactive learning has helped students effectively in the job market. The
method has already been used by another book authored by S. S. P. S. with Richard C. J.
Somerville, Climate Mathematics: Theory and Applications, also published by Cambridge
University Press in 2019.
We wrote this statistics and data visualization book partly because of our experience in
research and teaching. The book is built on class notes we wrote at Texas A&M University
(eight times taught as a semester-long course by G. R. N.), University of Alberta (twice
taught as a semester-long course by S. S. P. S.), University of Tokyo (once taught as a short
course on error estimation by S. S. P. S.), the NOAA National Centers of Environmental
Information (once taught as a short course mainly about R and its use in analyzing climate data with different formats and visualizing the analysis results by S. S. P. S.), and
the Chinese Academy of Sciences (once taught as a short course mainly about data visualization by R by S. S. P. S.). The courses were at graduate level and the audiences were
graduate students not only majoring in atmospheric and oceanic sciences, but also in engineering, mathematics, and statistics. Some audiences were climate research professionals.
The main purpose of the courses was to prepare students to correctly and efficiently use
statistical theory and methods to analyze climate data, visualize the data, and interpret data
analysis results.
Another motivation for writing the current book is the overwhelming problems in the
traditional statistics courses for today’s climate science. Climate science students may find
traditional statistics courses inadequate, as they often focus on the mathematical power of
the statistical theories, but not much on the practical data analysis examples, and even less
or not at all on the visualization of modern climate data. Such a course is not engaged with
the students’ research work and their career. For example, students need to plot data in
both 2D and 3D, and compute the empirical orthogonal functions for large data matrices.
Our book fills the gap and provides both computer codes and data that allow students
to make analysis and visualization, and to modify our codes for their research and jobs.
Our book may be considered as a toolbox for climate data. Because we purposely limited
the book size to avoid the audience being overwhelmed by a thick book, we thus leave
some computer codes on our book’s website www.climatestatistics.org, including
tutorials for R and Python, and some examples. The freely available toolbox on our website
will be convenient to use and will be updated with new data, computer codes, additional
exercise problems, and other resources to empower your interaction with the book. The
toolbox also allows a reader to try our learning-by-doing method first, before purchasing
our book.
We follow the education theory of learning-by-doing, which in our case means using your
computer and our R or Python code to interact with our book and modifying our computer codes and websites to analyze your own data and generate corresponding figures. Learningby-doing is the core methodology of the progressive education of John Dewey (1859–
1952), an American philosopher and educator. Dewey felt that the experience of students
and teachers together yields extra value for both. Instructors are not just to lecture and
project authority, instead they are to collaborate with students and guide students to gain
experience of solving problems of their interest. Although Dewey’s education theory was
established initially for schoolchildren, we feel that the same is applicable to undergraduate
and graduate students. Our way of learning-by-doing is to enable students to use R or
Python code and other resources in the book and its website to reproduce the figures and
numerical results in the book. Further, students can modify the computer code and solve
their own problems, such as visualizing the climate data in a similar format and of their
own interest, or analyzing their own data using a similar or a modified method. Thus,
audience interaction is the main innovative feature of our book, allowing the audience to
gain experience of practicing, thinking, applying, and consequently understanding. The
ancient Chinese educator Confucius (551–479 BC) said, “I hear, and I forget; I see, and I
remember; and I do, and I understand.” Although John Dewey and Confucius were more
than 2,000 years apart, they had a similar philosophy of learning-by-doing.
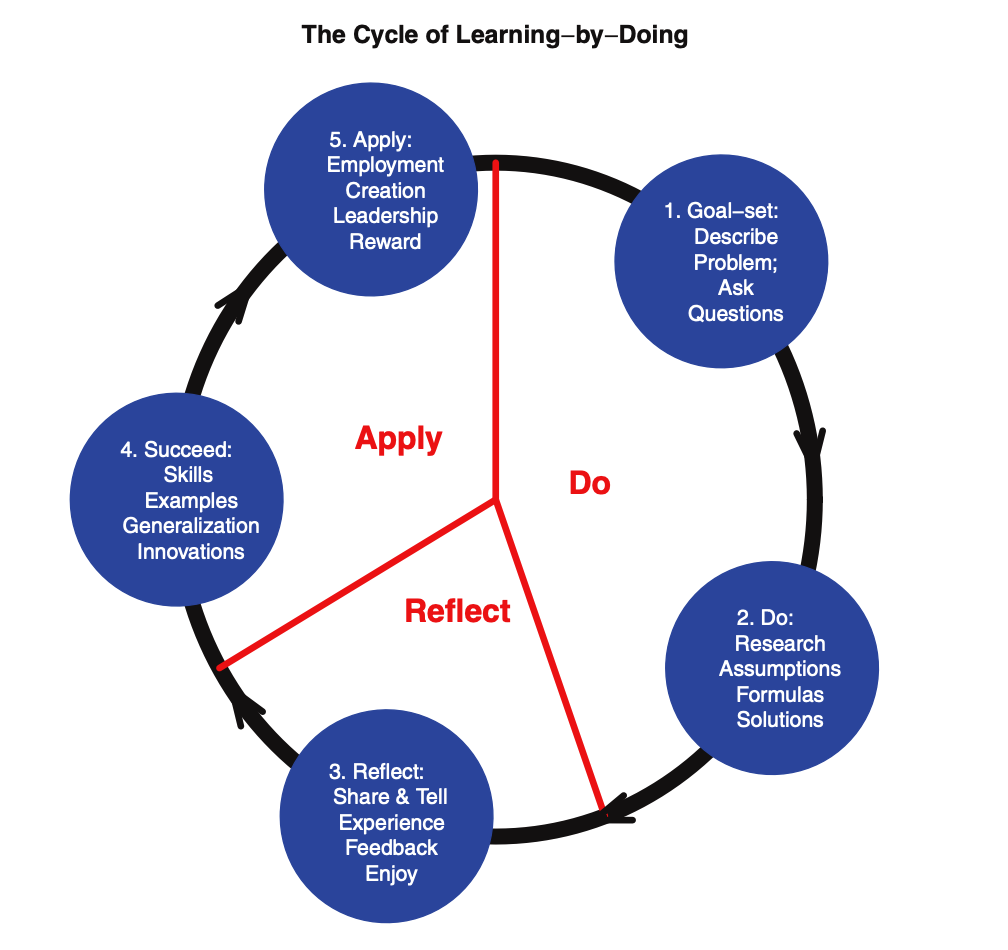
As illustrated in Figure 0.1, our pedagogy has three stages: do, reflect, and apply. Coauthor S. S. P. S. practiced this pedagogy in recent years. He presents a question or a problem
at the beginning of a class. Then he asks students to orally ask the same question, or
describe the same problem, or answer his question in their own words. For example, why is
the tiny amount of carbon dioxide in the atmosphere important for climate change? Next,
he and students search and re-search for data and literature, work on the observed carbon
dioxide data at Mauna Loa using computer data visualization, and discuss the structure of
greenhouse gasses whose molecules have three or more atoms. To understand the data better, they use more data analysis methods, such as the time series decomposition. Next, he
encourages his students to share this experience with their grandparents, other family members, or friends. Finally, students apply the skills gained to solve their own problems with
their own data, by doing homework, working on projects, finding employment, or making
innovations. In this cycle, students have gathered experience and skills to improve their
life and to engage with the community. In the short term, students trained in this progressive cycle of learning-by-doing have a better chance of becoming good problem solvers,
smooth story narrators, and active leaders in a research project in a lab or an internship
company, and consequently to become competitive in the job market. In the long term,
students trained in this cycle are likely to become to life-time learners and educators. John
Dewey said: “Education is not preparation for life but life itself.” We would like to modify
this to “Education is not only preparation for a better life, but also is life itself.”
Dewey’s progressive education theory is in a sharp contrast to the traditional learning
process based on the logic method, which aims at cultivating high-achieving scholars.
The commonly used pedagogy of lecture-read-homework-exam often uses the logic-based
approach. The climax of logic-based education is that the instructors have the pleasure of
presenting their method and theory, while students are so creative that they will produce a
new or a better theory. Many outstanding scholars went through their education this way,
and many excellent textbooks were written for this approach. However, our book does not follow this approach, since our book is written for the general population of students, not
just for the elite class or even scholars-to-be. If you wish to be such an ambitious scholar,
then you may use our book very differently: you can read the book quickly and critically
for gaining knowledge instead of skills, and skip our reader–book interaction functions.
Our pedagogy is result-oriented. If using car-driver and car-mechanic as metaphors, our
book targets the 99% or more who are car-drivers, and provides some clues for the less than
1% of the audience who wish to become car-mechanics. Good drivers understand the limits
of a car, are sensitive to abnormal noise or motion of a car, and can efficiently and safely
get from A to B. Therefore, this book emphasizes (i) assumptions of a method, (ii) core and
concise formulas, (iii) product development by a computer, and (iv) result interpretation.
This is in contrast with traditional books, which are often in an expanded format of (ii) with many mathematical derivations, and challenge the mathematical capability of most readers.
Our philosophy is to minimize the mathematical challenge, but to deepen the understanding
of the ideas using visual tools and using storytelling experience. Our audience will be able
to make an accurate problem statement, ask pointed questions, set up statistical models,
solve the models, and interpret solutions. Therefore, instead of aiming our training at the
few “mechanics” and thus incurring a high risk of failure, we wish to train a large number
of good “drivers” with a large probability of success.
The book has an extensive coverage of statistical methods useful in modern climate
science, ranging from probability density functions, machine learning basics, modern multivariate regression, and climate data analysis examples, to a variety of computer codes
written in R and Python for climate data visualization. The details are listed in the Table of
Contents. Each chapter starts with an outline of the materials and ends with a summary of
the methods discussed in the chapter. Examples are included for each major concept. The
website for this book www.climatestatistics.org is cross-linked with the CUP site
www.cambridge.org/climatestatistics.
Material-wise, our book has the following four distinct features:
(1) The book treats statistics as a language for every climate scientist to master. The book includes carefully selected statistical methods for modern climate science students. Every statistics formula in the book has a climate science interpretation, and every core climate data analysis is rigorously examined with statistical assumptions and limitations.
(2) The book describes a complete procedure for statistical modeling for climate data. The book discusses random fields, their meaning in statistical models of climate data, model solutions and interpretations, and machine learning.
(3) The book includes free computer codes in both R and Python for readers to conveniently visualize the commonly used climate data. The book has computer codes to analyze NCEP/NCAR Reanalysis data for EOF patterns, and has examples to analyze the NOAAGlobalTemp data for global warnings. The book website contains many online resources, such as an instructors’ guide, PowerPoint slides, images, and tutorials for R and Python coding. Readers can use the given computer codes to reproduce and modify all the figures in the book, and generate high-quality figures from their own datasets for reports and publications.
(4) This textbook has a large number of exercise problems and has solution manuals. Every chapter has at least 20 exercise problems for homework, tests, and term projects. A solutions manual with both R and Python codes is available for instructors from the Cambridge University Press.